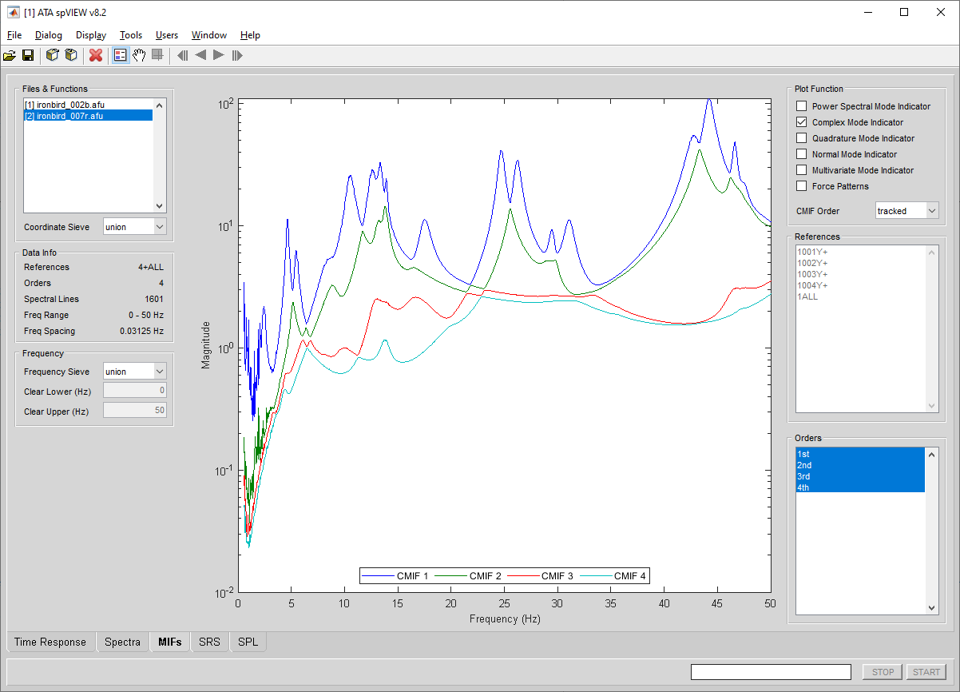
In the MIFs module, frequency-domain mode indicator functions are read into spVIEW and plotted. Mode indicator functions (MIFs) are typically computed from FRF and are a means to condense some information from a large number of measurements into a few functions. The supported MIF types are the power spectral (PSMIF), complex (CMIF), quadrature (QMIF), normal (NMIF), and multivariate (MMIF). The force patterns computed with MMIF are also supported. See the help documentation on the IMAT psmif, cmif, qmif, nmif, and mmif functions for more information about these mode indicator functions.
Some MIFs, such as PSMIF and NMIF, are identified by a references coordinate, while other MIFs, such as CMIF, QMIF, and MMIF, are identified by an order. Force patterns are identified by a references coordinate and an order. Information about the selected datasets and the references and orders in the Coordinate Sieve is displayed in the Data Info panel.
Selecting a plotted line with the mouse pointer and holding down the middle button will highlight that line and its corresponding entry in the plot legendand display the name from the legend in the message line at the bottom of the window. Selecting an entry in the plot legend with the middle mouse button will toggle highlighting of the corresponding line in the plot axes.
Frequency : Frequency Sieve – When multiple datasets are selected in the Files & Functions list, the Frequency Sieve determines the frequency range for plotting. The Frequency Sieve can be union or intersection, which sieves the frequency ranges of the selected datasets as set operator nomenclature implies, or manual, which allows the frequency range to be specified by the user by entering the Clear Lower and Clear Upper values.
Frequency : Clear Lower & Clear Upper – Enter numeric values in Hertz for the Clear Lower and Clear Upper frequencies. The X limits of the plot axes are set to the Clear Lower and Clear Upper frequencies. There is a context menu on the edit boxes to set the Clear Lower and Clear Upper frequencies according to the Frequency Sieve or to the plot axes X limits. These values can only be entered if the Frequency Sieve is manual.
Plot Function – Select the mode indicator functions or force patterns to plot. More than one Plot Function can be selected concurrently. The available selections are dependent on the type of functions contained in the datasets. If multiple datasets are selected in the Files & Functions list, the available Plot Functions are the intersection of the functions types contained in the selected datasets.
Plot Function : CMIF Order – Select the ordering of the CMIF and QMIF functions. If the CMIF Order is sorted, the CMIF and QMIF functions are sorted by decreasing magnitude at each spectral line. When CMIF Order is tracked, the CMIF and QMIF functions are sorted based on the similarity of the left singular vectors between adjacent spectral lines. Tracking can be used to evaluate CMIF crossovers that appear as peaks in the lower CMIF functions.
References – Select the references to plot for PSMIF, NMIF, and force patterns. Use the context menu to select the attributes listed or displayed in the legend.
Orders – Select the orders to plot for CMIF, QMIF, MMIF, and force patterns. Use the context menu to select the attributes displayed in the legend.
Tools > MIFs > Send Plot MIFs to IMAT Plot – Sends the plotted mode indicator functions, truncated according to the Frequency Sieve, to an IMAT plot figure.
Tools > MIFs > Send Plot MIFs to UIPLOT – Sends the plotted mode indicator functions, truncated according to the Frequency Sieve, to UIPLOT.
Tools > MIFs > Decimation – The mode indicator functions are decimated using the IMAT decimate function as
G = DECIMATE(F,FACTOR)
See the help documentation on this function for more detailed information. An input dialog is presented to define the input arguments to the function. Follow the prompts on the dialog to enter the FACTOR input argument. A new dataset is appended to the Files & Functions list. This operation is executed for all datasets selected in the Files & Functions list.
Tools > MIFs > Interpolation – The mode indicator functions are interpolated using the IMAT interp function as
G = INTERP(F,'inc',INCREMENT,'lin',METHOD[,EXTRAPTYPE])
See the help documentation on this function for more detailed information. An input dialog is presented to define the input arguments to the function. Follow the prompts on the dialog to enter the INCREMENT, METHOD, and optional EXTRAPTYPE input arguments. A new dataset is appended to the Files & Functions list. This operation is executed for all datasets selected in the Files & Functions list.
Tools > MIFs > PSMIF Square Root Scaling – The magnitude of PSMIF is on the order of the squared magnitude of the FRF from which the PSMIF are generated. However, the magnitude of CMIF is on the same order of magnitude as the FRF from which CMIF are generated. In order to plot PSMIF and CMIF with comparable magnitudes, this tool takes the square root of the PSMIF in the dataset. A new dataset that contains all of the MIFs in the original dataset is appended to the Files & Functions list. This operation is executed for all datasets selected in the Files & Functions list.