Mode Match Form
Mode Match Form
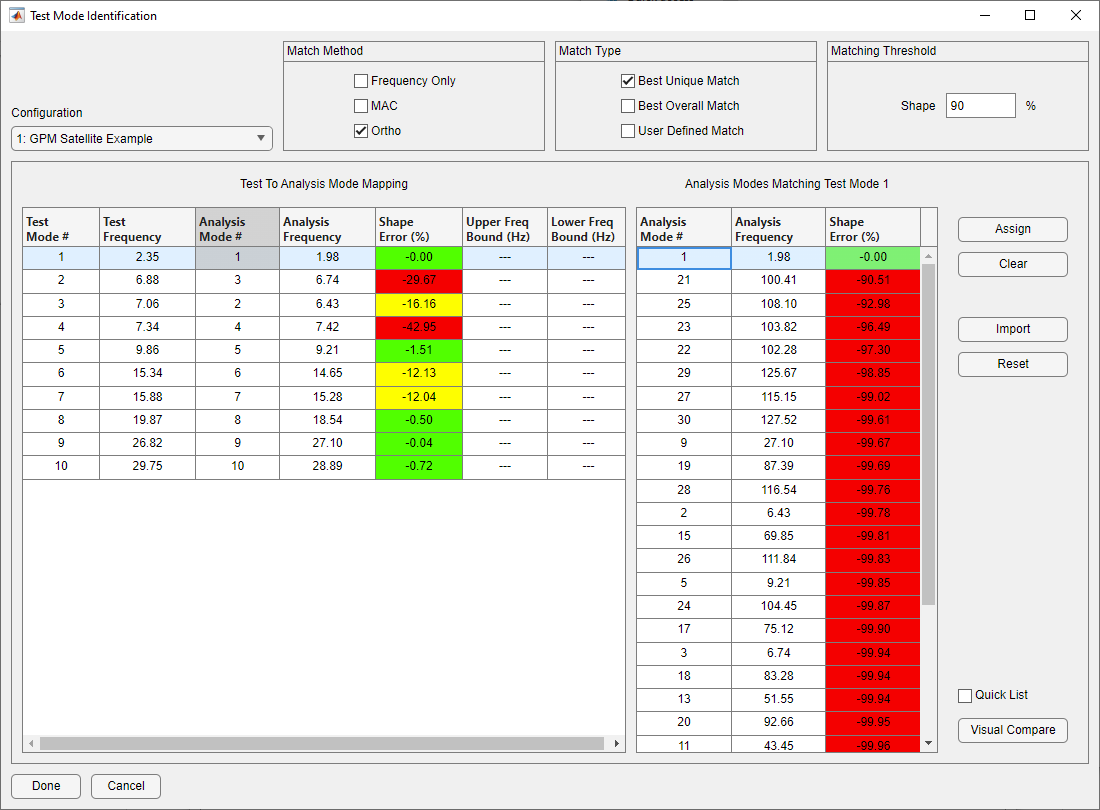
The Test Mode Identification form is created by clicking the Match Modes button on the main form. This form allows the user to redefine the automatic mode mapping. The form shows a summary of the mode matches in the table on the left. Only one configuration can be viewed at a time, and is changed using the configuration pull-down on the top right of the form. When a row of the table on the left is selected (corresponding to a test mode for that configuration), the table on the right lists all of the analysis modes and the cross-orthogonality between the selected test mode and each analysis mode. If Quick List is toggled on, all modes with cross-orthogonality errors lower than the Match Threshold will be displayed. If there are no modes with errors lower than the threshold, the match with the smallest error will be displayed.
The user can change the automatic mode mapping by selecting a row of the table on the right corresponding to the new analysis mode which is to be assigned as a match for the currently selected test mode and then clicking the Assign button. The table on the left will be updated with the newly defined mapping.
The user can also remove any match for a selected test mode by selecting the corresponding row of the table on the left and clicking the Clear button. This will remove any state variable associated with that test mode. The table is updated to reflect that no analysis mode maps to that test mode.
The user can also reset all of the mode matches for a given configuration by clicking the Reset button. This button will erase any user-defined matching and return the mapping to that created automatically. Otherwise, all user-defined changes to mode mapping will be preserved throughout the optimization process.
The user can specify the matches between modes for a specified configuration by clicking the Import button. The import button allows the user to specify a text file containing a comma-delimited list of test modes and their corresponding analysis modes. The file should contain two columns of data. The first column contains the integer ID for the test mode and the second column contains the integer ID of the corresponding analysis mode. The user should only list test modes for which a corresponding analysis mode match is desired. Any test modes not included in the imported list will be assumed to have no match.
The method by which the modes are automatically matched can be changed using the Shape Options panel. Best Overall Match will pick the best match for each mode, while Best Unique Match will do the same but force each match to be unique. Selecting User Defined Match will cause Attune to treat all matches as user-defined. For user-defined matches during optimization, Attune will not attempt to determine which analysis modes best match the target modes. Instead, Attune will attempt to determine which analysis mode for a given design best matches the analysis mode the user identified as a match.
The Match Threshold changes the threshold for the maximum shape error that will be considered for a match. If a mode does not have a match within the threshold, it will remain unmatched. To control the analysis frequency range allowed for a potential test mode match, set an upper and/or lower bound directly on the corresponding row of the summary table. These frequency bounds persist through optimization and will only allow an automatic match if the analysis frequency is within the defined range.
The method buttons above the summary table allow the user to choose the metric by which mode matches are made: cross-orthogonality (Ortho) or cross-MAC (MAC). Cross-orthogonality is only available if a reduced-mass matrix of the analytical model was provided. If the reduced-mass matrix is not provided, the cross-orthogonality button is disabled. The buttons affect (and reflect) whichever configurations are shown in the pulldown menu above it. Thus, if the configuration is set to the second configuration and a new metric is selected, that method will be applied to only that configuration.
Selecting Frequency Only as the match method will force Attune to create only frequency state variables. If the frequencies were derived from test data read from shape data, automatic matching may still be used to define the correlation between target and analysis frequencies. Matches between target frequencies and analysis frequencies are then considered user-defined and are maintained through the correlation process in the same way as user-defined mode shape matches. The method can be switched back to cross-orthogonality or cross-MAC as long as the user does not go back and manually input frequencies on the Configuration Form.
Visual Compare Form

Visual Comparison Window Launched From the Mode Match Form
For a more visual matching experience, pressing the Visual Compare button will bring up the Visual Mode Comparison window. This model window contains the Test and Analysis models plotted on top of one another. The currently selected test mode in the Test to Analysis Mode Mapping Table will be plotted as deformation and contour on the test model. If that test mode has a match, the analysis model will display the corresponding analysis shape. Each time a new test mode is selected, the plot will update.
If an analysis mode is selected from the Analysis Mode Matching Table, the analysis model will be updated with that mode, even if its not part of a match. This allows the test mode and analysis modes to be individually plotted to visually match them up. If a new match is desired from the currently selected modes, press Assign.