Monte Carlo Form

Monte Carlo Form
The Monte Carlo Optimization form is created by clicking the Optimization button on the main form with the adjacent pulldown menu set to Monte Carlo. The Monte Carlo optimization method is a “brute force” algorithm that generates a pool of random designs (uniform sampling over the allowed range of each design variable) and evaluates them based on the objective function. The best design is the one among these that minimizes the objective function. All active design variables must have effective upper and lower bounds assigned for this optimization method. While the Monte Carlo form is open, no other Attune form can be activated. This prevents the initial design shown on the optimization form from being inconsistent with the rest of Attune. The design and state tables on the Monte Carlo form can be used to track the current state of the design.
The Monte Carlo algorithm has three additional inputs: population size, plot interval, and overall design weight. Population Size determines how many designs the algorithm will evaluate. The Plot Interval controls how often the plot is updated. The Overall Design Weight allows the user to emphasize or deemphasize the cost of changes to design variables as a whole with respect to improvements in the correlation of the model. A larger overall design weight means that the user is willing to trade some improvement in model correlation to ensure smaller changes in design variables. A smaller overall design weight indicates the converse. If the overall design weight is set to zero, changes in design variables are not considered part of the objective function.
The plot axis on the Monte Carlo form shows a scatter plot of the objective value functions for every evaluated design in the population. The values are continuously sorted by objective value so that the design with the minimum objective value always appears on the right. The green line indicates the objective value for the current design.
Understanding the distribution of objective function values as a function of design variables is key for effective use of the Monte Carlo method. As such, instrospection options are available by pressing the Plot Corner Plot and Plot Lower Bounds buttons. The corner plot is useful to understand the relationship between the different design variables within their value ranges and understand their sensitivities. Each subplot shows a contour plot of the objective function for a pair of design variables while other design variables are held fixed at their current value. The diagonal of subplots shows the lower extent of the objective values within the bounds of a single design variable. The Plot Lower Bounds button will display a sequence of only the plots on the diagonal, useful for closer inspection. From this information, it is easy to see relationships between design variables, which can indicate either variable independence, positive correlation, or negative correlation. From the plots below, it is clear that the BUSE variable needs to increase, irrespective of the influence of other variables. This is a strong signal that the range of this variable can be narrowed around its optimum, which will have the effect of filling out the lower bounds curves for other design variables (i.e., the dense set of points near the optimum of BUSE will help fill in the lower bounds of other variables). This technique forms the basis of an optimization approach where variables with well-known optima are narrowed in range first while iteratively increasing understanding of the influence of other variables. In doing so, each iteration will gradually get closer to the optimal solution (this is a form of manual steepest decent, but with interactive user introspection and control).

Monte Carlo Corner Plot
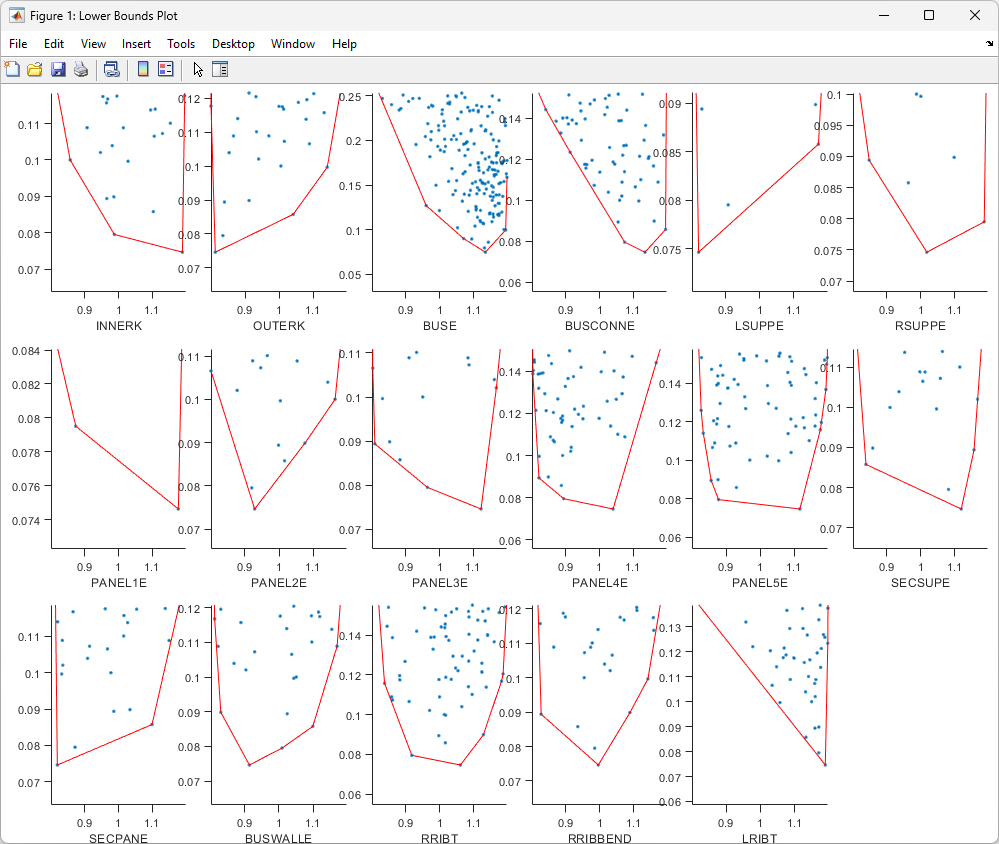
Monte Carlo Lower Bounds Plot
The Monte Carlo optimization is run by clicking the Optimize button. If, for some reason, the optimization needs to be stopped while it is in progress, pressing Cancel on the progress dialog will stop the optimization after the current evaluation has been completed. After optimizing, the best value columns will be populated with corresponding values from the best optimization design. The Save Design button is used to keep the best design from the evaluated population, which will be added to the optimization history. The design and state tables will then be updated showing that the current and best designs are now the same.